Lance Inimgba

Data science enthusiast who loves getting lost in Jupyter notebooks 😋
Love travel and foodie actvities!
View My LinkedIn Profile
Healthcare Project

IMPORTANT NOTE!! You may right click on any of the images and click “Open image in new tab” to enlarge any of the images below
In this project we are going to play the level of a newly hired healthcare data analyst at a hospital and because our supervisor is busy, they have given us a lot of tasks to handle for them.
The tasks:
- What does the time spent in the hospital look like? Are the majority of our patients spending less than 7 days?
- Try to find out which medical specialties have the highest number of procedures on average.
- Are there any racial discrepancies? (based on the number of lab procedures done)
- Do patients who get a lot of lab procedures/tests done stay longer in the hospital?
- We want to perform a medical test on any patient who is either African-American or has an “Up” value for metformin. Please help us compile a list of patients who meet this criteria
- Find “success stories” where patients who came into the hospital with an emergency (
admission_type_idis 1), but stayed less than the average time in the hospital - We are asked to write a summary for the top 50 medical patients in a format like this: “Patient 2383 was Caucasian and was readmitted. They had 21 medications and 32 lab procedures.”
This SQL project will show us how versatile this dataset is and tease the possibilities of how much time can be spent on it. Because of all the columns that this dataset contains, there are so many insights and relationships that can be looked at and tested. But because of “job duties”, we’ll just be skimming the tip of the iceberg.
Why This Project and What is the Data?
I chose this project because I was interested in a health domain-focused dataset to add to my data repository! Also, because my mother is a nurse, I have always had a curiosity for the health industry at large and always wondered how or if I could make a contribution to it without having to go to nursing or medical school! 😂
For this project, we are using this diabetic-focused dataset. This dataset represents 10 years of data (1999-2008) and is specifically geared toward the analysis of factors regarding patient readmission and other outcomes pertaining specifically to diabetic patients. But the version that we’re using is a modified version on Kaggle and we aren’t focusing either on readmissions or diabetic-factors to complete our assigned tasks in the previous section.
Data Dictionary
There are over 40 columns of data, so I will only go over the relevant ones that’ll be most crucial to our data analysis for this project:
patient_nbr: An individual patient’s identifiertime_in_hospital: Number of days that a patient has spent in the hospitalnum_procedures: Number of procedures that a patient has hadnum_lab_procedures: Number of lab procedures that a patient has hadnum_medications: Number of times that medications have been administered to a patient
Now let’s get to our given tasks and our data analysis!
Data Analysis
What does the time spent in the hospital look like? Are the majority of our patients spending less than 7 days?
To start out, first we’re going to create a histogram! This might sound odd to see that because SQL isn’t necessarily renowned for its visualization capabilities, but there is a query we can use to produce a histogram.
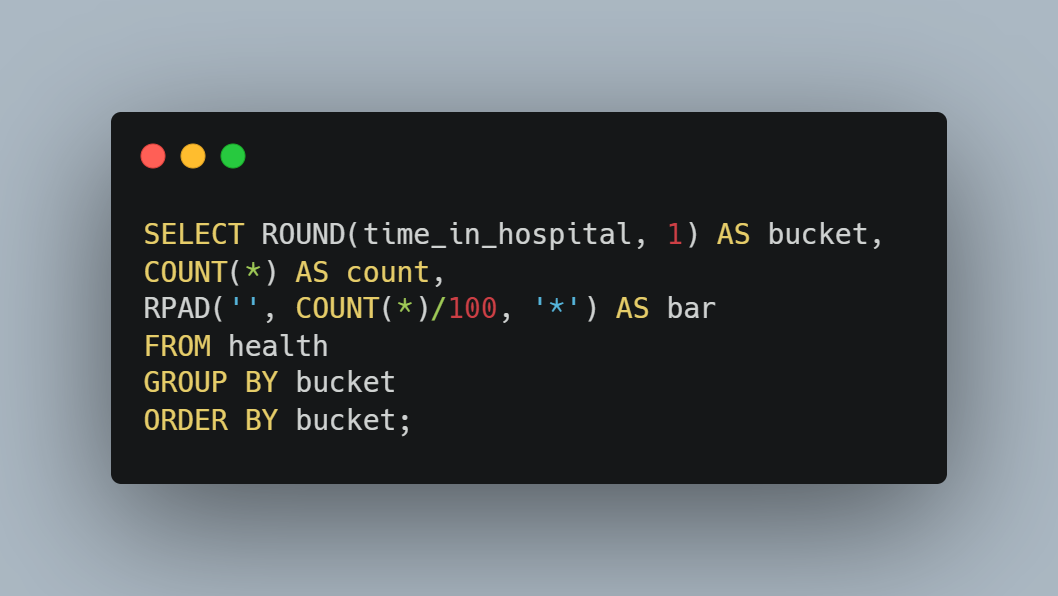
We use this query to output the histogram. Note that we are using the time_in_hospital column as we’re trying to determine whether the majority of our patients are spending less than 7 days in the hospital. Knowing that our patients are spending less than 7 days in the hospital can free up beds faster in the event of overcrowding and also save some money for both us and the patient! Let’s print our histogram now.
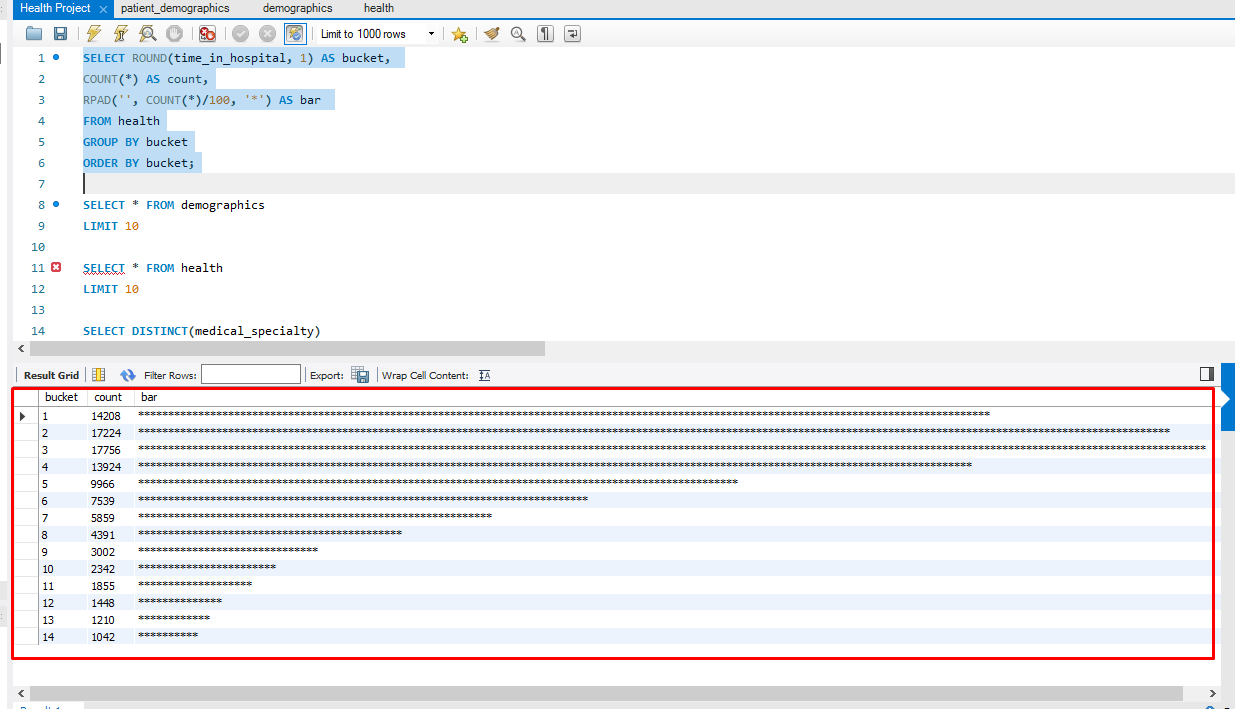
As we can see by the results, the majority of our patients do indeed spend less than 7 days in our hospital beds!
Try to find out which medical specialties have the highest number of procedures on average.
Now with this line of code we’re going to check out the distinct values (or fields) in the medical_specialty column using the following query.
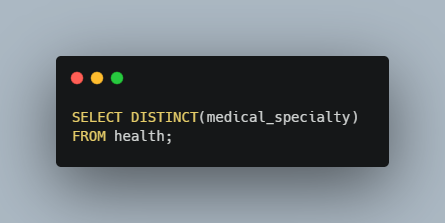
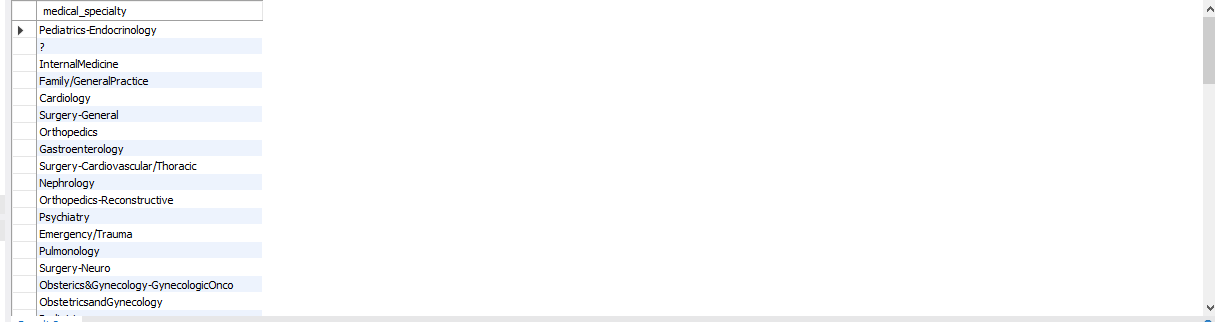
I also counted the unique values in the medical_specialty column and it turns out that we have 73 distinct values.
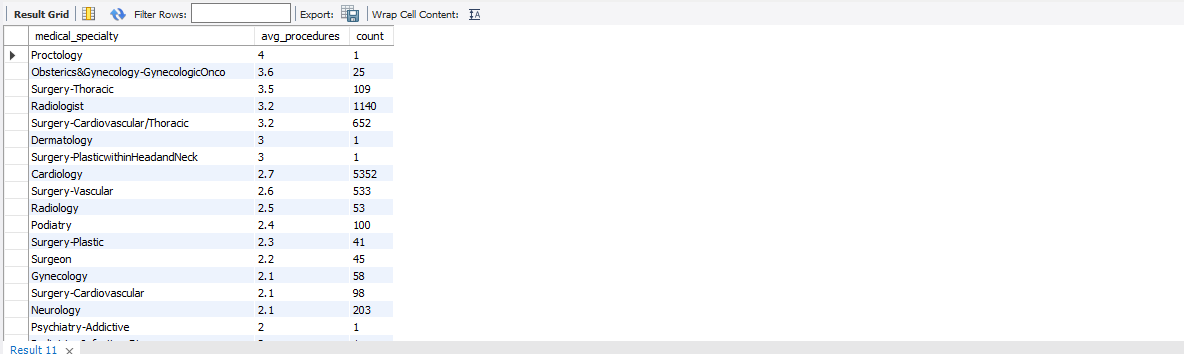
Now that we know what those are, let’s create a query that groups all the values of medical_specialty together and find the average num_procedures per specialty. We also want to count how many patients there are per specialty (please note that one row in this dataset represents one patient).
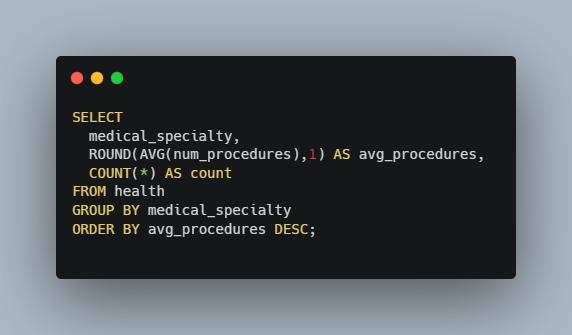
And here are a few lines of the output
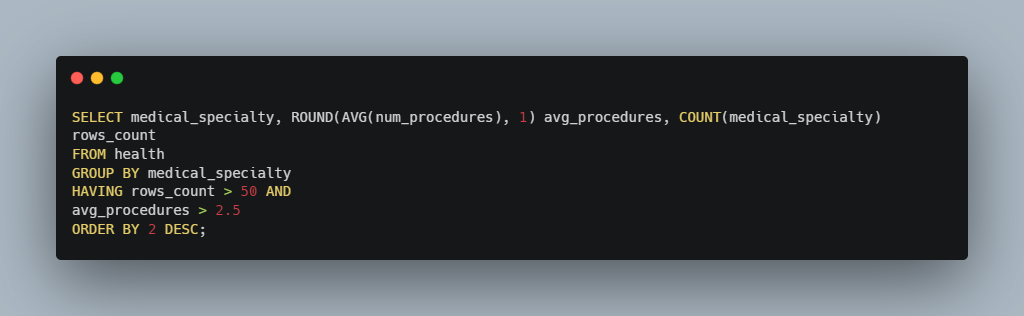
Not only does it look more organized now, but we are closer to our next goal of answering which specialties have the highest number of procedures on average. So let’s say that our supervisor instructs us to filter down to specialties that have at least 50 patients and an average of at least 2.5 procedures per patient for a given specialty. With this we should have a great idea on what specialties to focus on!
So let’s put this concept into a query and see what we get.
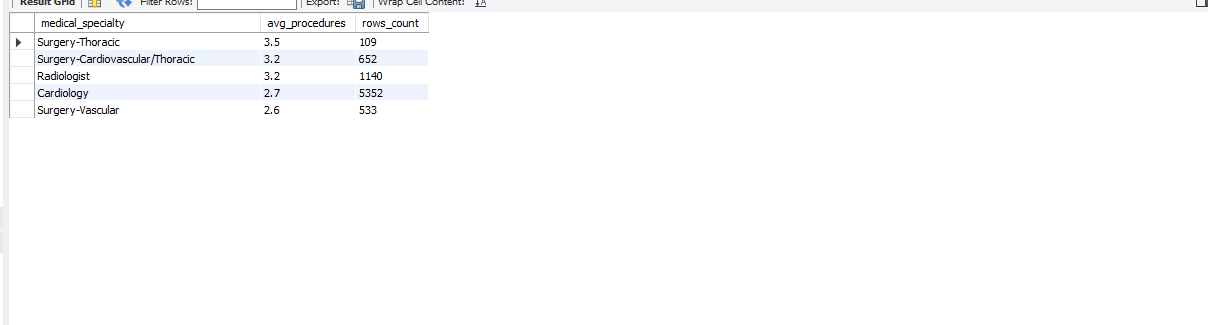
Just as planned! We now have 5 specialties that were able to meet our rigorous criteria and as we can see from both the avg_procedures and rows_count columns, a lot of patients are treated in these specialties and they get at least 2.5 procedures too. These are amazing results and I’m quite sure that the supervisor will be delighted with these results!
Are there any racial discrepancies? (based on the number of lab procedures done)
Next, our supervisor has asked us to check to see if there are any discrepancies in treatment based on race. For this purpose, we will use the num_lab_procedures that patients from all racial backgrounds are receiving the highest quality treatment. The table that we have been using until now, patient, doesn’t have any information that outlines a person’s racial background. Therefore, we will use another table called demographics employing the SQL inner join technique along the shared patient_nbr column to ensure that we can properly align the demographic info of the new table to the parent table. The patient_nbr column is our primary key for both tables, so we know that the values present are all unique.
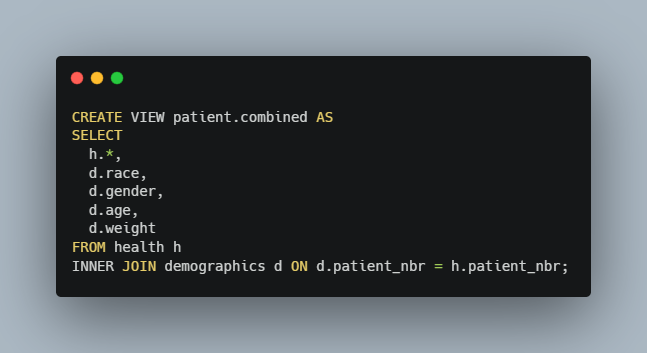
For this query, we created a CTE and used it in a view to use for future reference and set up our join and the columns to be displayed from said join. Next we want to take that view and create a query that categorizes our database by race and uses the average of num_lab_proceduresand we can determine whether all of our patients are getting equal treatment.
Here is the query:
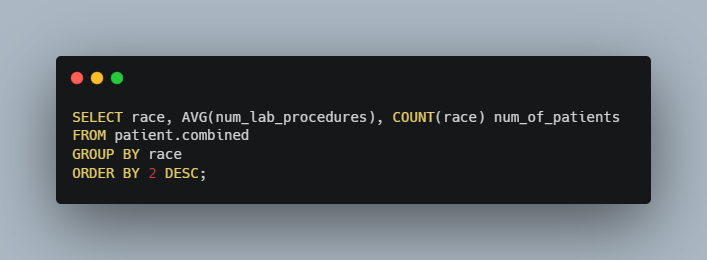
And the output:
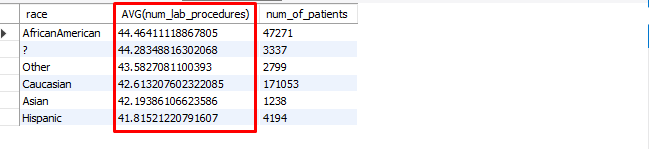
From these results, we can determine that there aren’t any outliers that would indicate the presence of preferential treatment due to racial makeup. Now let’s move further in our analysis.
Do patients who get a lot of procedures/tests done stay longer in the hospital?
Next we were asked to see if patients that have a lot of procedures done tend to have longer stay times in the hospital. First, we run a query that gives a sense of the data distribution for the num_lab_procedures column.
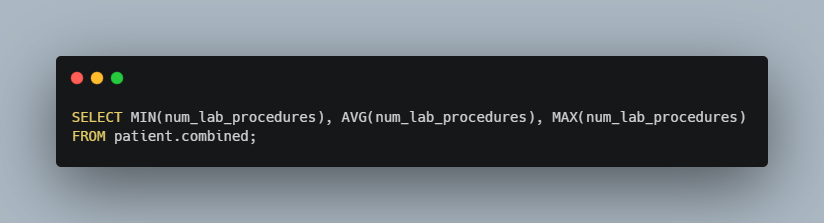
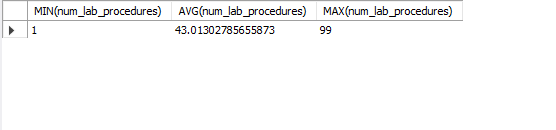
From the output, we can see that num_lab_procedures has an average value of around 43 procedures. With this knowledge, we can use a series of CASE statements to categorize our patients based on their num_lab_procedures value. If a value for num_lab_procedures falls within 0-24 it will be assigned the tag of “few”, for 25-54: “average”, for over 55: “many”.
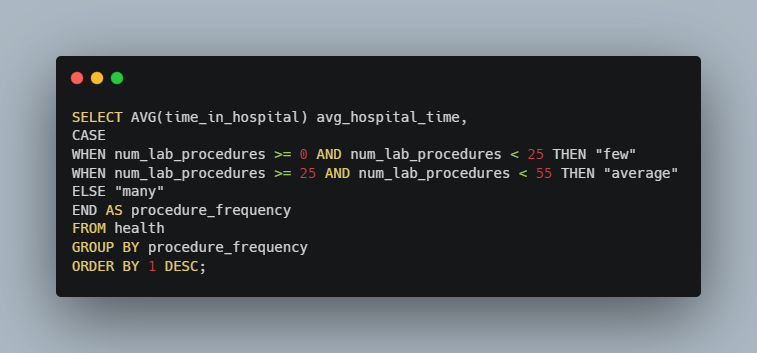
Now we are going to create a query that creates these tags for every patient, groups all of them by these tags and looks at the average hospital stay per group. Now, let’s look at that query and its output together
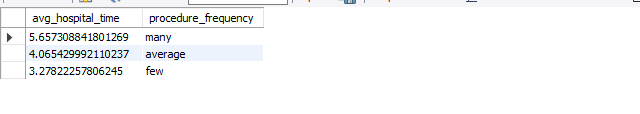
From what we have seen, we can now draw a positive correlation between time spent in the hospital and how many procedures that they have. The longer a patient stays at a hospital the more procedures they have and the shorter their stay, the fewer procedures they have.
We want to perform a medical test on any patient who is either African-American or had an “Up” value for metformin. Please help us compile a list of patients who meet this criteria
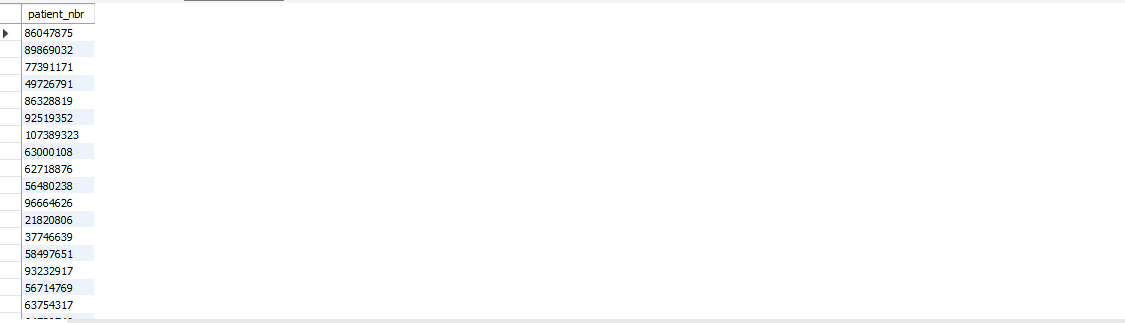
Next, I’ve been tasked to compile a list of patients who are either African-American or have a value of “Up” for the metformin column. Here is a simple query that we can use, making use of the UNION function. Some lines of the output will also be displayed.
Find “success stories” where patients who came into the hospital with an emergency (admission_type_id is 1), but stayed less than the average time in the hospital
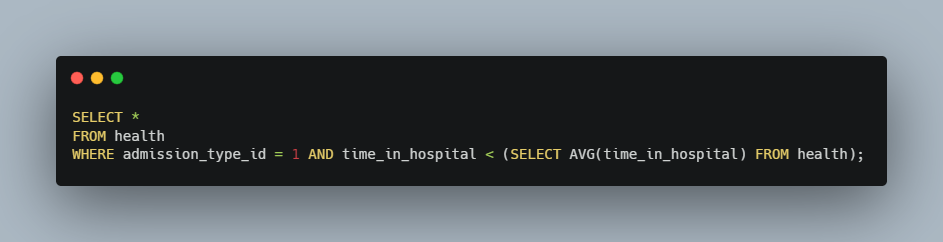
To find these success stories, we have to have something in our query like this: WHERE time_in_hospital < AVG(time_in_hospital). But actually, this wouldn’t work and it would produce an error because we can’t use AVG in a WHERE clause, only in a SELECT clause. So we have to use a subquery to work around this. Here is an example of how we can get what we want:
Subqueries are a useful tool, but they can make things look messy if we have a lot of them to manage. Therefore, we can once again use a CTE to make things more neat. Last time we created a VIEW, so this time we’re going to use WITH. We’ll update the query and confirm that the output is still the same as our previous query.
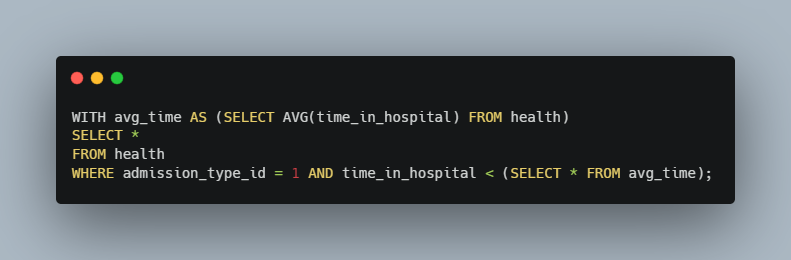
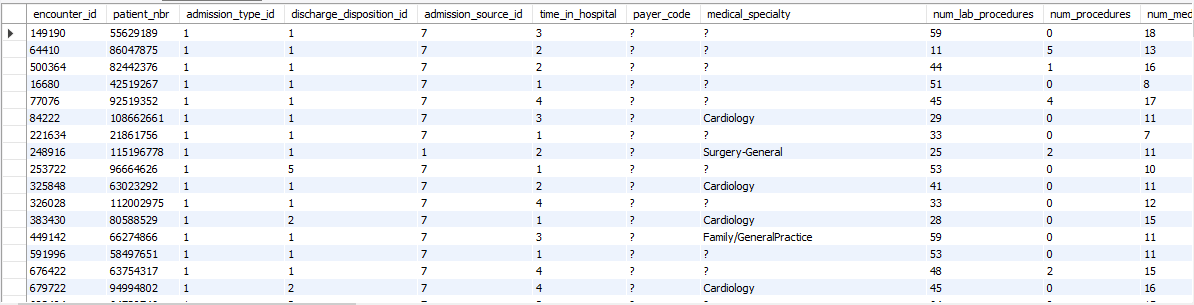
With the help of the WITH CTE our subquery has now been condensed from (SELECT AVG(time_in_hospital) FROM health) to just (SELECT * FROM avg_time).
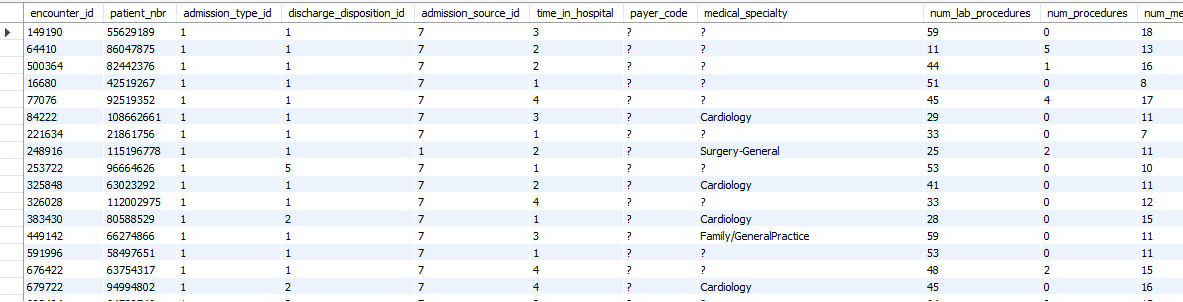
And we also have a nice list of “success story” patients to provide to our supervisor too!
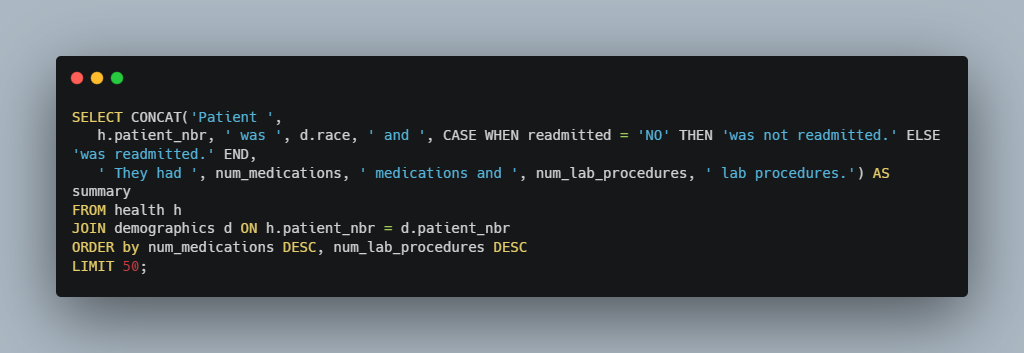
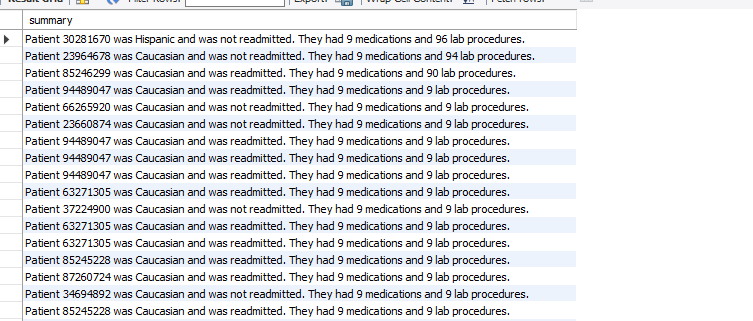
Next we’ve been asked to generate a query that will summarize the results of the top 50 medicated patients along with the number of lab procedures that they had(table will be ordered by num_medicationsand afterwards num_lab_procedures). The output of our queries should produce values in this format:
We are asked to write a summary for the top 50 medical patients in a format like this: “Patient 2383 was Caucasian and was readmitted. They had 21 medications and 32 lab procedures.”
Using a combination of CONCAT and CASE, we will be able to generate multiple summaries like this. Here is the query and the output below:
Recap/Conclusion
In conclusion, we set out to complete the tasks that our supervisor instructed us to and we’ve done just that. To review what was asked of us, let’s refresh our memories with the below tasks:
- What does the time spent in the hospital look like? Are the majority of our patients spending less than 7 days?
- Try to find out which medical specialties have the highest number of procedures on average.
- Are there any racial discrepancies? (based on the number of lab procedures done)
- Do patients who get a lot of procedures/tests done stay longer in the hospital?
- We want to perform a medical test on any patient who is either African-American or has an “Up” value for metformin. Please help us compile a list of patients who meet this criteria
- Find “success stories” where patients who came into the hospital with an emergency (
admission_type_idis 1), but stayed less than the average time in the hospital - We are asked to write a summary for the top 50 medical patients in a format like this: “Patient 2383 was Caucasian and was readmitted. They had 21 medications and 32 lab procedures.”
From my own standpoint, the most interesting insights that we can come away with are that we weren’t able to find any racial favoritism amongst the patients, the cardiology department had by far the highest amount of admitted patients and that we were able to find a strong correlation between the number of lab procedures done and length of time spent for our patients in the hospital.
I didn’t know much about our patients going into this dataset, but now I have a much firmer understanding of them thanks to this brief analysis! I’ll stop here for now, but I’d definitely like to jump back into this dataset sometime in the near future.
Thank you so much for your time and reading all of this! This was an absolute pleasure to do and if you have any questions, please comment below or please contact me at lance.inimgba@gmail.com or on LinkedIn!
I’m actively looking for new opportunities in the data science field, so please don’t hesitate to contact me if you know of anything out there!