Lance Inimgba

Data science enthusiast who loves getting lost in Jupyter notebooks 😋
Love travel and foodie actvities!
View My LinkedIn Profile
NBA Analytics Project

IMPORTANT NOTE!! You may right click on any of the images and click “Open image in new tab” to enlarge any of the images below
For this project I am going to assume the role of an entry-level data analyst interviewee for my hometown NBA team, the Minnesota Timberwolves. My goal is to display how we can use data to try to add potential talent to our team and we will display how we can using Tableau.
This project is something that I feel personally excited about because I thoroughly love all things sports and seeing how integral that data science has become across all across sports. It has actually led to teams improvement by acquiring players and even aiding in individual player development. Since I’m interested in this domain, I’d like to continue doing hobby projects and maybe work for some team’s front office perhaps!
Here are just some of the things that I took away from my interactions with the data:
- Both Nikola Jokic and Jayson Tatum are very dominant outliers.
- Anthony Edwards is very similar to Zach Lavine and Donovan Mitchell but at least 5 years younger!
- Sacramento Kings have the best 3-point shooting power forwards in the league!
- Joel Embiid stands out a lot! Find out why!
- Some shooting guards actually have more assists than some point guards!
In the upcoming data analysis section, I’ll explain how I came away with these insights! If you’re a hard core hoops fan though, I’ll warn you in advance, but your favorite all-star caliber players might not stand out as much as you think—at least in this brief analytics project!
The What and The Where of this Dataset
This dataset can be found here at this popular hoops website called Basketball Reference. The data is already clean and all we have to do is feed it as it is to Tableau.
The dataset itself encompasses the total stats (not per game split) of the entirety of the NBA players who played at least one game in the 2021-22 NBA season. Since we know it’s from a trusty source and cross-checked the numbers with other trustworthy NBA sources.
Data Dictionary
There are over 20 columns of data, but we only need few columns to find the answers we’re looking for:
- Player : A player’s name
- Pos: Player position
- Age: A player’s age
- Tm: A player’s team during the 2021-22 season
- G: Total games played
- 3P%: Three-point shot percentage
- TRB: Total Rebounds
- AST: Total Assists
- PTS: Total Points
Now let’s begin the data analysis section!!
Data Analysis
So let’s imagine that we’re trying to find potential free agent signings based on their performances last season.
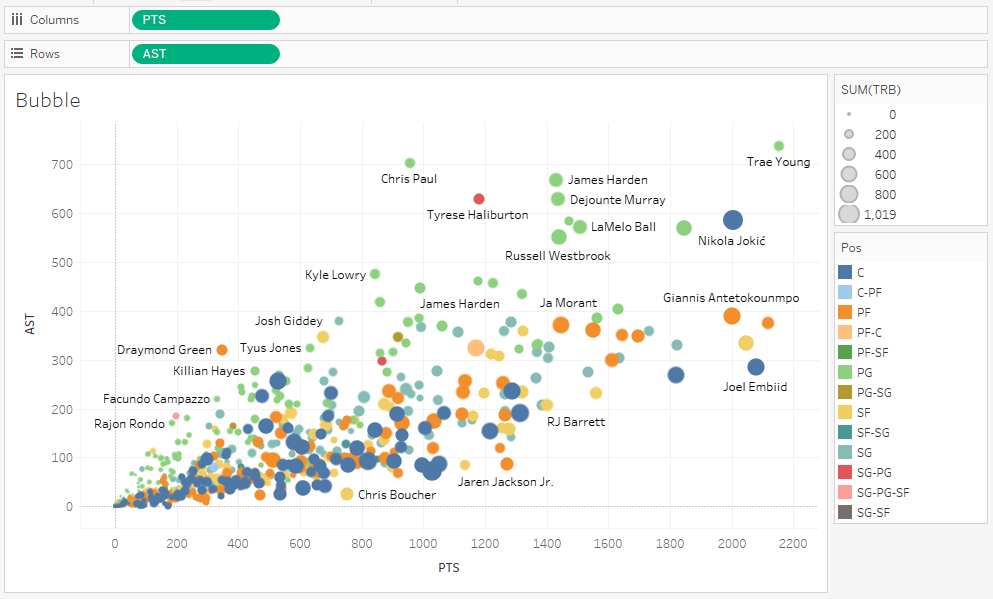
First, we’re going to create a scatter plot featuring all the players featuring the PTS, AST, TRB, Pos and G columns. This is how it looks like below:
For an interactive graph
Assuming that you’re viewing the interactive graph using the link that I provided, we can see that Trae Young had both the highest amount of points and assists in the 2021-22 NBA regular season and played in 76 out of 82 games. From what we can see, Trae Young has the highest offensive output, but we don’t exactly know what that signifies yet. All we can say is that he is probably at least the most important player on his team and wouldn’t necessarily be a reasonable option to try and acquire.
There are some outlier players out there though. First of all let’s take a look at Nikola Jokic (PTS 2004, AST 584 on the graph) . Note that he’s a center, and while he has a high amount of rebounds as expected as a center(in fact, the highest total), he also has more assists than even most point guards! Another outlier I’d like to look at is Jayson Tatum, too because he seems to be far and away the best SF (small forward) on the chart. He has the most points of any SF, he’s top 3 in assists at SF as well and he also has the most rebounds of any of his SF peers.
Another interesting thing that I gleaned was I was also able to observe that Anthony Edwards, a SG (shooting guard), is among the top SGs in the league at only 20 years old and if you observe the graph, he is seemingly on the same trajectory as players like Donovan Mitchell and Zach Lavine who are several years older than him. We are extremely fortunate to have him and I think we should provide all the resources he needs to ensure that he reaches his potential.
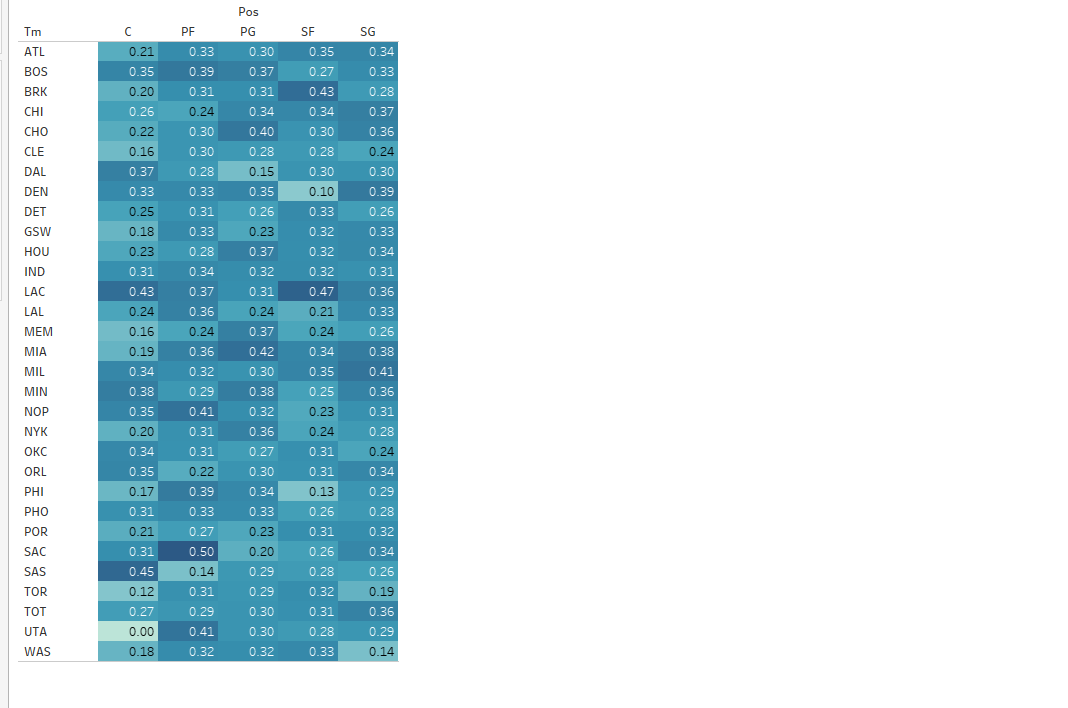
Next we want to find ways in which we can improve our three-point shooting percentage, so we are going to construct a heatmap that will display the top three-point percentages of every position for each team in the league.
For an interactive graph
If we wanted to add a PF to our team, I would look no further than adding one from the Sacramento Kings roster because as a position they are shooting 50% from three-point range collectively. The team that I represent, the Minnesota Timberwolves, is weak at three-point shooting at the PF position, so getting a PF from the Kings would represent a huge upgrade to us.
Another chart that we can create to observe players who stand out on their team is called a stacked bar chart. We are going to create a bar chart for each individual team’s total points and then from there, separate out the bars by the individual players on each team and color code them to make them easier to understand. So in other words, this chart will allow us to see which players contribute to their team’s total points the most.
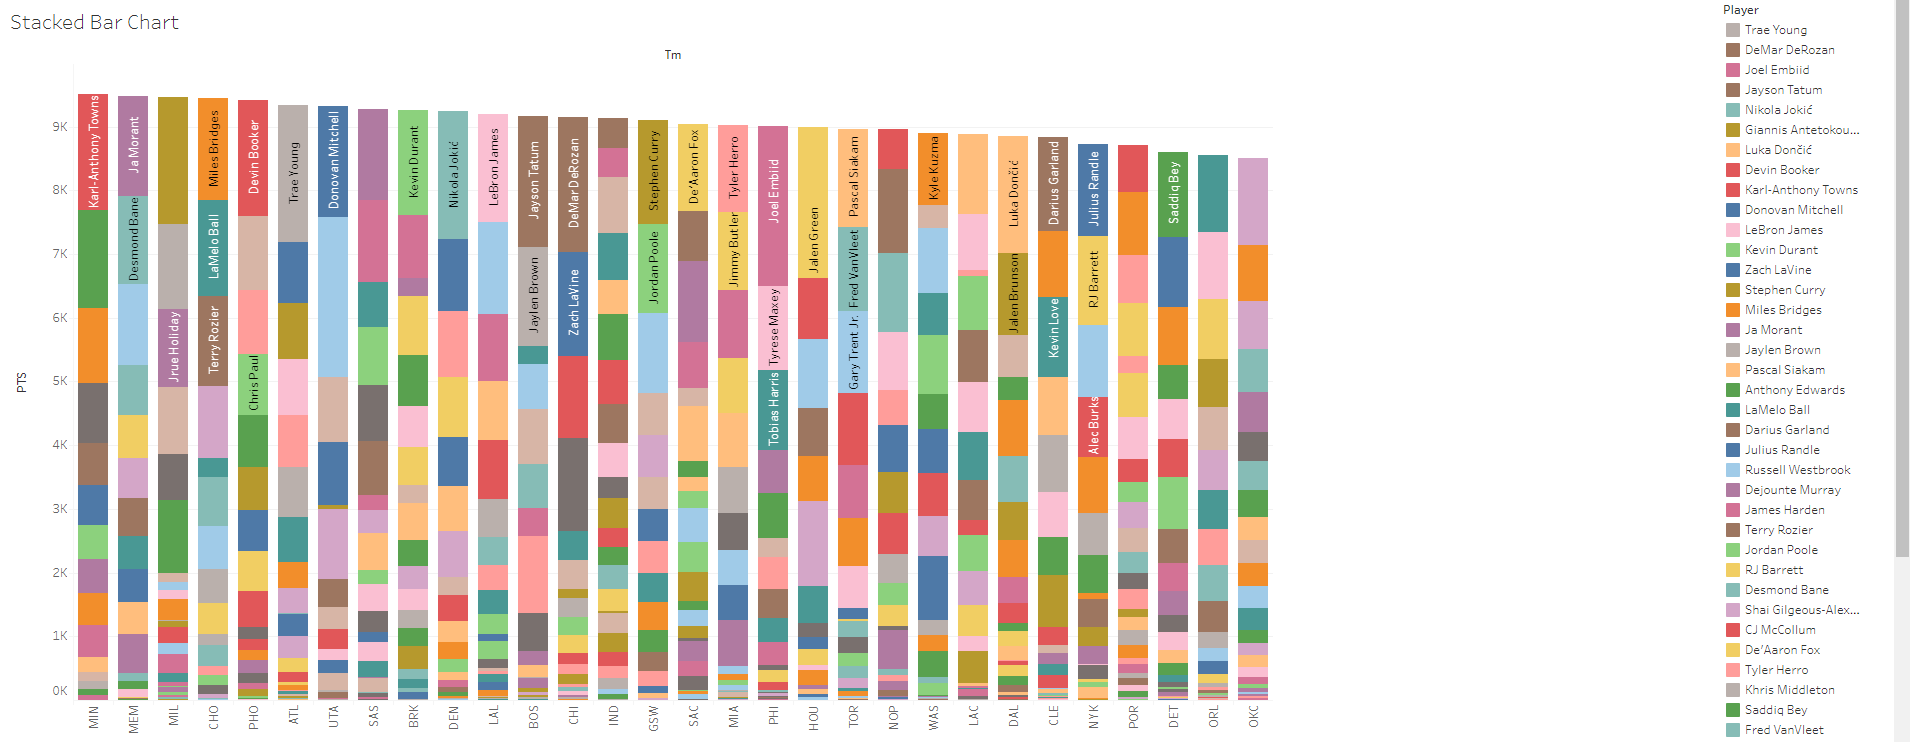
Some quick things that we can see are that my team, the Minnesota Timberwolves, scored the most points collectively in the NBA and the Oklahoma City Thunder collectively scored the fewest points as a team.
But we can also see how many points that individual players contribute to the point total of their individual teams. The player who stands out to me is Joel Embiid of the Philadelphia 76ers. As a group, the 76ers scored just over 9,000 points for the entire season and Joel Embiid contributed to nearly 2,100 points of those 9,000 by himself! That is a remarkable contribution and would definitely help out my Minnesota Timberwolves if we were able to acquire him.
It’s interesting to see the contrast of team’s like the 76ers that rely mostly on one main scorer over teams like Charlotte, Toronto and Memphis that rely on three main scorers. Another interesting question that we can save for another time is whether teams that can split up the scoring more are more successful than teams that have one dominant scorer.
Lastly, we want to add players who can help improve upon the assist numbers for the Timberwolves last season. So to do this, we are going to take a look at another visualization known as a treemap and see what we can take away from it.
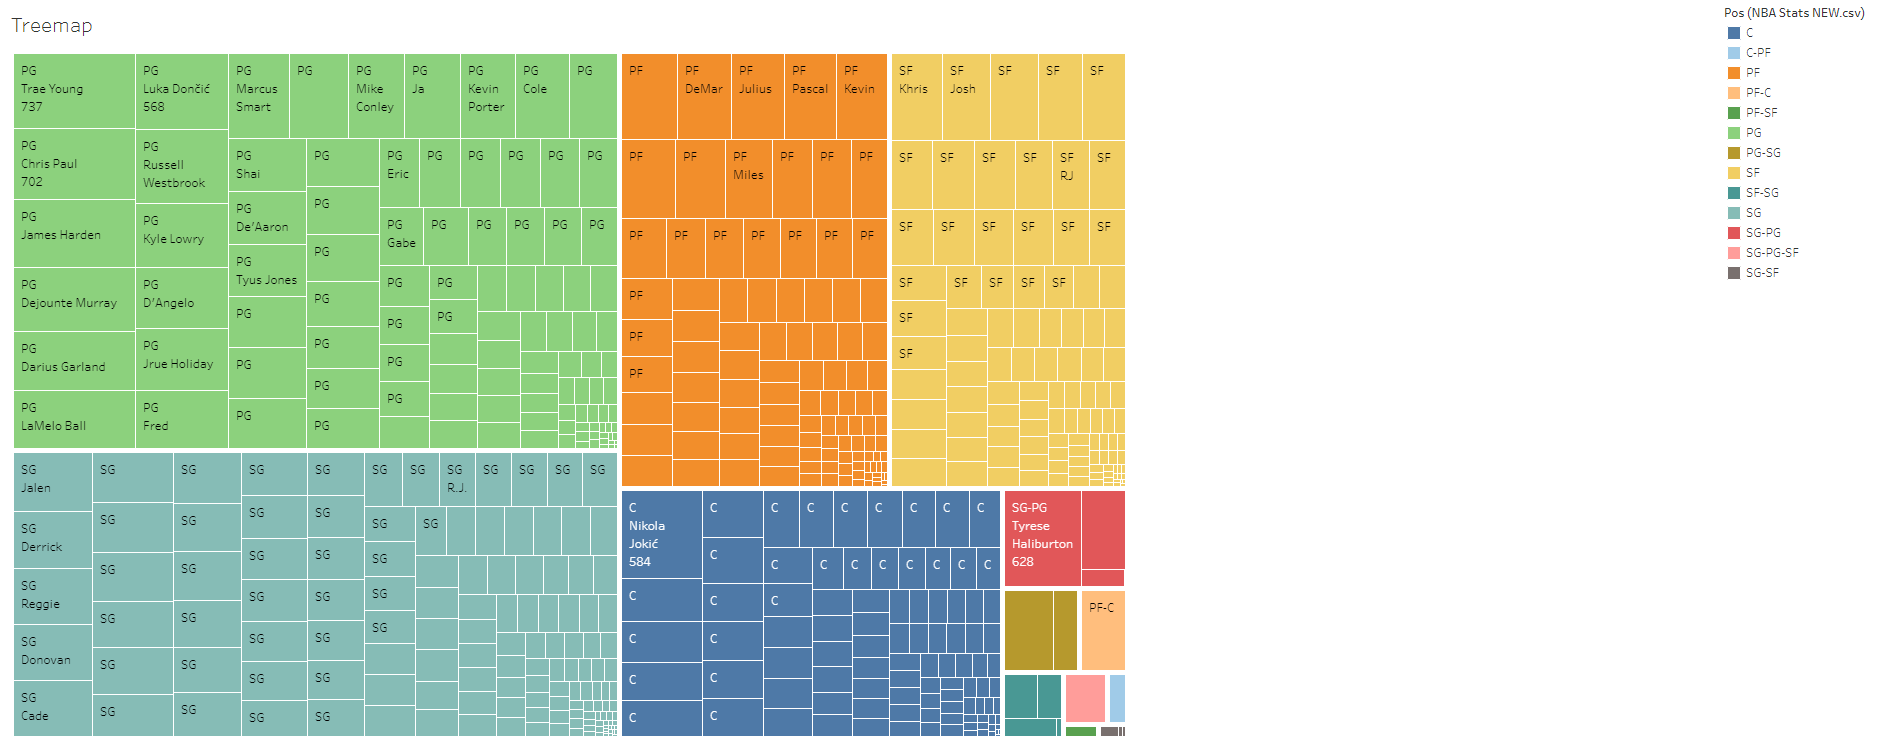
Immediately upon looking at the treemap, Nikola Jokic, the player who stood out to us on the bubble visualization (the first one) we created earlier, once again stands out here. He has by far the highest assist total at the C (center) position and has more assists than the top assist leaders for every position except PG (point guard) and some of the combo positions (like PF-C, PG-SG, etc.)
And while we’re on the topic of combo positions, another player who stood out to me was Tyrese Haliburton who is a SG-PG combo and one of the few on this dataset. He has more assists than all but three “pure” PG players and he has over 1.5 times more assists than the leading “pure” SG. If we could add a player to improve our assist total, I think that he’s the one to add. Because not only will he add more assists to our team, but looking at the bubble visualization once again, he will also add a good amount of scoring as well!
Recap/Conclusion
In conclusion, I set out to analyze the performances of player stats during the 2021-22 season to find opportunities to improve the Minnesota Timberwolves. And I was also able to show why and how:
- Nikola Jokic and Jayson Tatum are amazing talents
- Anthony Edwards has a shot of being the best SG in the NBA
- The Sacramento Kings have the best 3-point shooting power forwards in the league!
- Joel Embiid is such a huge contributor for his team
- Some shooting guards actually have more assists than some point guards!
Overall, I hope that this provided a clearer picture on how we can use data to evaluate talent in the NBA and how it can actually be used in NBA team front-offices to build stronger squads that will hopefully ultimately result in a more successful season and entertaining product for fans to watch. As a basketball fan myself, I still think having an “eye” for talent and having actual knowledge of the game can’t be completely supplanted by data, but both facets are complementary in assembling a successful NBA organization and building a championship team.
Obviously on the corporate-level, there are entire data teams dedicated to acquiring talent on NBA teams, so finding the best possible fits for each team isn’t nearly as straightforward as some parts of this project made it seem. But as far as deeper dives are concerned, this dataset is quite ripe for the pickings, so I may revisit this dataset in the near future!
Thank you so much for your time and reading all of this! This was an absolute pleasure to do and if you have any questions, please comment below or please contact me at lance.inimgba@gmail.com or on LinkedIn!
I’m actively looking for new opportunities in the data science field, so please don’t hesitate to contact me if you know of anything out there!